8. Policies That Trigger Gentrification in Kyoto City
- Tomohiko Yoshida, Professor of Urban and Regional Planning, Ritsumeikan University (Japan)
Introduction: Discussing Gentrification
Gentrification occurs when the dilapidation of the inner area located around the city’s center reverses through a process of public and/or private sector construction and urban redevelopment that forces existing residents to move out. High-income residents then move in, and consequently, the average income of people living in the inner area increases. Fujitsuka () systematically introduced gentrification to Japan’s academic communities, drawing on examples in large cities in the United Kingdom and the United States since the 1980s and various examples in other Western countries. Gentrification developed as follows: first, in the second half of the 1970s, gentrification in Western countries began due to the tendency of people to return to the downtown area because of long commutes. Second, historical buildings began to be regenerated in the 1980s. Third, gentrification took place in conjunction with the forced eviction of people in low income brackets, elderly people, and people in racial and ethnic minority groups. In short, then, gentrification was characterized by the return of people from the city’s suburbs to the inner area, the regeneration of historical buildings, and the forced displacement of minority groups. Thus, according to Fujitsuka’s theory, gentrification can be theoretically explained by temporal changes in the existing built-up areas, the accumulation of historical buildings, and the trend of lower-income people moving out of the inner area. However, some studies on gentrification depend on statistical indicators and observation periods.
Scholars have identified gentrification—observed in cities in the United States, the United Kingdom, and Australia in the 1970s due to the appearance of white-collar workers engaged in technical and managerial occupations—as a new problem within capitalist society. Therefore, differences in gentrification among these three countries meant inquiring into the ideal state of capitalism (). For example, in the United States, those in the low income bracket mainly live in private rental houses; in the United Kingdom, low-income earners live in publicly operated housing; and in Australia, most can relatively easily acquire their own homes. Therefore, the processes of gentrification differed among these three countries as a matter of course. In particular, because the displacement pressure exerted on existing residents by administrative authorities and real estate agencies was extremely fierce during the gentrifying process in large cities in the United States, the movement against urban redevelopment intensified there and existing residents' attitudes toward gentrification also raised their awareness about local politics. Indeed, in the United States, the movement against gentrification led the Presidential Committee in 1976 to enact of the Housing and Community Development Act of 1978 (). Because gentrification attracted attention as a remarkable social phenomenon, scholars like Smith & Williams (), for example, mainly used simple indicators for geographical analysis, such as the ratio of rented houses, the ratio of white people, and the ratio of people in low income brackets.
Fujitsuka () produced an overview of trends in studies on gentrification and described a range of theoretical approaches. One study applied institutionalism to investigate the redevelopment of inner areas by administrative authorities that resulted in the soaring prices of houses in the 1980s. Another study examined whether gentrification followed a reverse to the filtering process—in which people in higher income brackets moved out of inner areas, resulting in an increase in the number of people in lower income brackets—from a social stratification perspective. One study analyzed gentrification in the field of economics from the perspective that house rents tend to increase as the land’s potential value increases. In another study on gentrification, increasing numbers of residents, such as single mothers, artists, and people in sexual minorities, were defined as people in the new middle class. In Fujitsuka’s study, which studied Kyoto City as the case, the ratio of “workers engaged in specialized and technical jobs” living in Kyoto City was calculated based on the occupational classification in the population census of each old school district (). The workers were defined as gentrifiers, and the districts experiencing gentrification were defined as those in which the ratio of the gentrifiers was high. Fujitsuka () pointed out that an investigation of the temporal trend of gentrification was important even if it was examined over a short period.
Dinga et al. () also analyzed gentrification in detail from the perspective of change over time. Based on the long-term census in each statistical tract in the U.S. city of Philadelphia over 33 years from 1980 to 2013 (along with address data contained in the Consumer Credit Panel from 2002 to 2014), they analyzed the actual movement of households and linked the statistics to the data. Dinga et al. determined the median house prices, house rents, and the ratio of university graduates in each neighborhood district. When the obtained medians for specific districts were higher than the medians in the entire city, the neighborhood was defined as a “gentrifying district.” When the obtained medians were lower, the neighborhood was defined as a “nongentrifying district” or “nongentrifiable district.” Subsequently, the probabilities of people moving into and out of these districts were obtained. Dinga et al. identified 128 districts as nongentrifying districts, 56 districts as gentrifying districts, and 181 districts as nongentrifiable districts.
Using Auckland, New Zealand as a case, Liu et al. () compared and examined the methods of identifying gentrification. They compared fluctuations in building and land values between two points in time (from the perspective of reinvestment in housing) using statistics on building and land values. They used statistical indicators (social aspects), such as management, legal management, professional population, median annual income, non-homeownership rate, and ethnic composition, as variables for the classification of districts. They also examined two clustering methods, k-means clustering and boundary-value analysis. Meltzer and Ghorbani () examined income fluctuations, calculated the average income of people living in each census tract in the population censuses in 2000 and 2008, obtained the difference in the average income between 2000 and 2008, and defined “gentrifying” and “substantially gentrifying” based on the size of the difference. Similarly, McKinnish et al. () used individual data obtained in the population censuses at two points in time (1990 and 2000) and calculated the incomes of households living in each census tract using the first quintile.
As mentioned above, to identify the location of a gentrification district in geography, social attributes such as occupations, the number of university graduates, and ethnic composition must be classified in addition to economic attributes such as income, house prices, and land prices.
Which Areas are Gentrifying in Kyoto?
This chapter examines the case of Kyoto City, which is an internationally known tourist destination. The total number of guests staying in Kyoto City annually is 13.17 million, 3.8 million of which are foreign guests. Kyoto City is the most famous tourist city in Japan and well-known as a historical city. In particular, the present author first considered how both the prosperity derived from tourism and the execution of city planning policies (including the New Urban Landscape Ordinances enforced in 2007) meant to maintain historicity impacted the advance of gentrification in Kyoto City. Next, I explored how the Hotel Business Act revised in 2016 affected the locations of hotels, inns, and lodging houses, with attention to the movements of these facilities around 2016. Specifically, I analyzed data on population and land prices because many previous studies used statistical indicators related to social and economic attributes for the geographical definition of gentrification. Because the latest population census was conducted in 2015, and a rapid change in residential population was unlikely, we analyzed fluctuations in population by age group from 2005 to 2015. We also analyzed the percentage changes in land prices during two four year periods: 2005 to 2009 and 2014 to 2018.
In Japan, to record the standards for land transaction prices in cities, the national government has determined standard points in each city and published the land prices based on the standard points as of January 1 each year. The national government has provided the official land prices of 632 standard points in Kyoto Prefecture in a time series on its portal site so that point data storing these official land prices can be used through the Geographic Information System (GIS). Most of the 632 standard points are residential areas. However, offices and dwelling houses combined with shops are included in some standard points. The left and right graphs in Fig. 8.1 show the increase in official land prices from 2005 to 2009 and 2014 to 2018, respectively, as obtained by interpolation estimation using inverse distance weighing (IDW). The increases in official land prices were obtained by dividing the difference in land prices at two points in time by the older land price. For example: (the increase rate of land price from 2005 to 2009) = [(land price in 2009) ‒ (land price in 2005)]/(land price in 2005). In Fig. 8.1, zones in which land prices have increased are expressed in four groups ranging from 20% to 35% at 5% intervals. Zones with an increase rate below 20% and zones in which land prices decreased are not shown Fig. 8.1. In zones with the highest increase rate, land prices increased by more than 35% during four years. The temporal changes in land prices were observed at 242 points in Kyoto City during four years from 2005 to 2009. The highest increase rate was 68.7% and the greatest decrease rate was -17.4%. From 2014 to 2018, land prices were collected from 273 points. The highest increase rate was 112.0% and the highest decrease rate was -10.3%. The difference between the highest increase rate and the highest decrease rate was larger in the second half of the four year periods. Therefore, economic conditions were excellent in the second half. In the first half of 2014–2018, although economic conditions were still affected by the global economic downturn precipitated by the Lehman Brothers bankruptcy in September 2008, land prices of the central districts in Kyoto City increased.
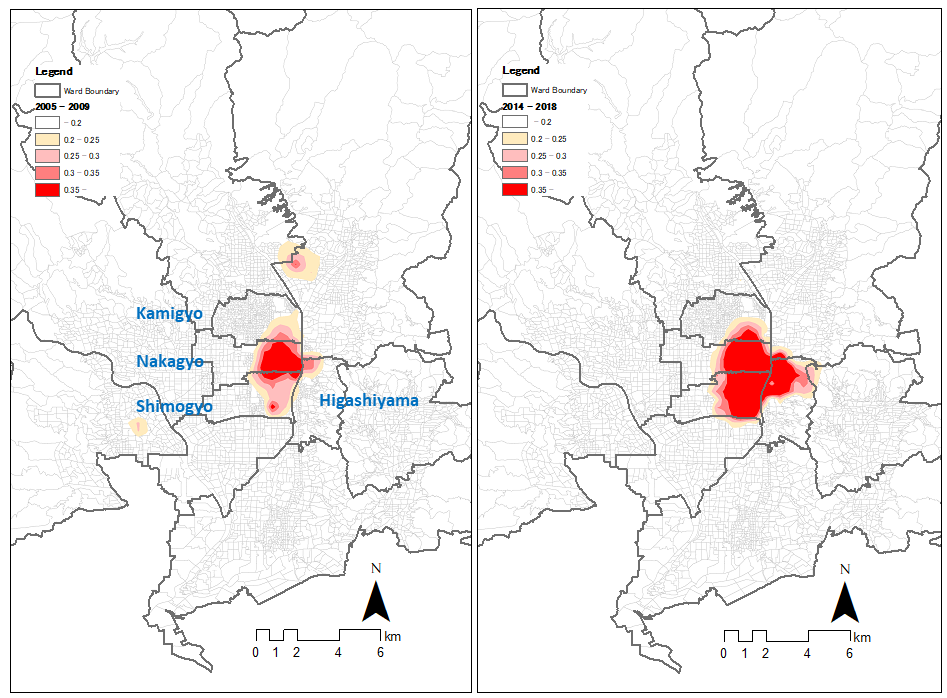
As shown on the left in Fig. 8.1, remarkable increases in land prices were observed in the central business district (CBD) consisting largely of four blocks surrounded by the three north-south streets of Kawaramachi-dori, Karasuma-dori, and Horikawa-dori, and the three east-west streets of Oike-dori, Shijo-dori, and Gojo-dori. Because these four blocks look like “田” in the Japanese language, this district is called “田の字(tanoji).”
The right graph in Fig. 8.1 shows the changes in land prices from 2014 to 2018 using the same colors as those used on the left. In Kyoto City, three wards—Kamigyo, Nakagyo, and Shimogyo—are located in the downtown area from the north to the south, and Higashiyama Ward is located to the east of Nakagyo Ward and Shimogyo Ward. As shown in the right graph, zones with increasing land prices widely expanded in the eastern parts of Nakagyo Ward and Shimogyo Ward and in the northern part of Higashiyama Ward. From 2005 to 2009, zones with land prices continuously increasing widely expanded to surround the CBD, in which land prices had increased remarkably. Therefore, a hypothesis can be made that gentrification began from the CBD and expanded at the CBD’s eastern, northern, and southern sides, thus surrounding the CBD.
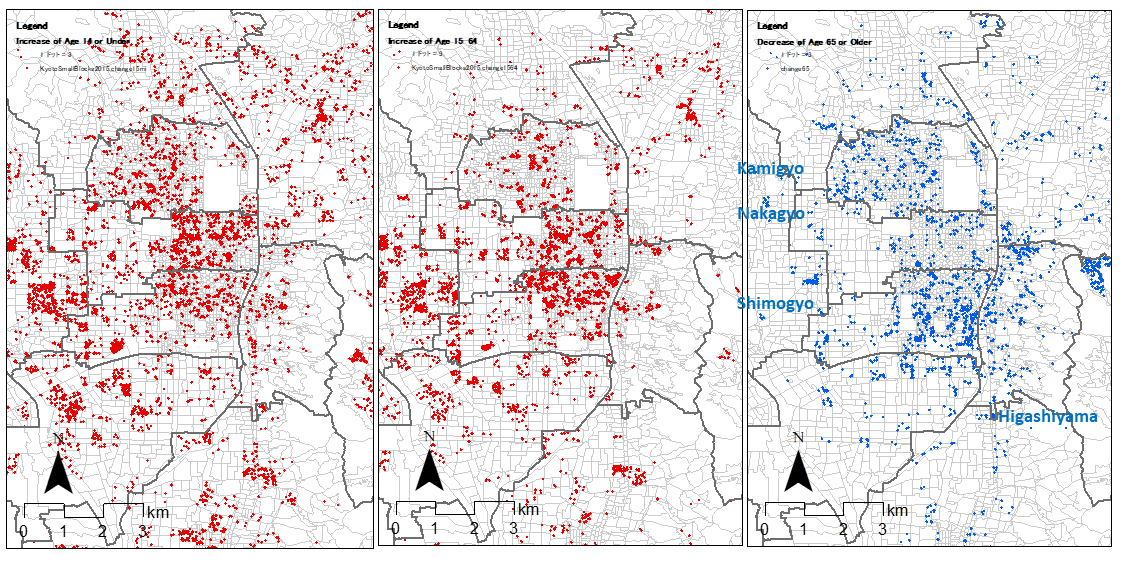
Fig. 8.2 shows three dot density maps obtained by ArcGIS using census tract data from the population census. The dot density maps indicate fluctuations in population by age group in each census tract in the period from 2005 to 2015, which differs from the periods in Fig. 8.1. The left graph shows increases in population below 14 years of age. The middle graph shows increases in populations from 15 to 64 years of age. The right graph shows decreases in population above 65 years of age. The differences in ages between the youngest and oldest age groups are 15 years and 50 years in the right and middle graphs, respectively. In the right graph, the difference in age between the youngest and oldest age groups may be 20 years when average life expectancy is considered. Although the three graphs are quite difficult to compare—because one dot represents three, nine, and three people in the left, middle, and right graphs, respectively—these graphs may in fact be compared productively with one another. Polygons expressed by light gray lines in the background of each graph indicate the shape of each census tract. In addition, because data on census tracts with a small number of residents were concealed and unified, consistency between two points in time was difficult to achieve. Therefore, an analysis of these census tracts was omitted. Because concealment and unification are often used for data on hilly and mountainous areas, large errors are unlikely to have occurred in this study’s analysis of urban areas.
Notably, the population below 14 years of age increased in the eastern part of Nakagyo Ward and the population between 15 and 64 years of age increased in the eastern part of Nakagyo Ward and the northern part of Shimogyo Ward. In the three wards, although people living in the downtown area experienced the global economic downturn precipitated by the Lehman Brothers bankruptcy in September 2008, the land prices increased and the populations among those of productive ages and their children also increased.
The right graph shows decreases in population above 65 years of age in the form of real numbers. Unlike the left and middle graphs, negative absolute values are expressed by dots in the right graph. Therefore, these values are expressed in blue instead of red in the left and middle graphs. As shown in the right graph, the population decreased remarkably in the eastern part of Shimogyo Ward. When increases in population in the left and middle graphs and decreases in population in the right graph are considered simultaneously, increases in population in areas at the center of Kyoto City, such as the eastern part of Nakagyo Ward and the northeastern part of Shimogyo Ward, together with a decrease in elderly people in areas surrounding the downtown area, have largely changed Kyoto City’s population composition. In other words, gentrifiers in the period from 2005 to 2015 were young people at productive ages newly migrating into areas at the center of Kyoto City, while elderly people were displaced both voluntarily or forcibly. As mentioned below, the number of elderly people decreased significantly in the eastern part of Shimogyo Ward and the western part of Higashiyama Ward while the number of lodging houses rapidly increased. Housing vacancies due to a decrease in the number of elderly was considered to result in an increase in the number of lodging houses.
For Kyoto City, the “inner areas” that became a popular topic after the 1970s in the fields of geography and city planning are located in the northwestern and southern parts of Kyoto City, some distance away from the CBD. The Higashikujo area in Minmi Ward (with a large Korean population) and the Nishijin area in Kamigyo Ward (where small- and medium-sized factories that produce traditional Nishijin brocade are located) have been considered to be typical inner areas (). An established theory is that gentrification generally occurs in the inner areas (). Since the 2000s, inner areas have not been subject to increases in land prices and number of employees. Thus, gentrification might occur in the CBD or its neighborhood area instead of inner areas.
City Planning to Promote the First Wave of Gentrification
This chapter describes the process of gentrification in Kyoto City after the 2000s. To this end, it is necessary to examine the institutional framework of height control districts as a factor in city planning.
In Japan, the Building Standards Law and the City Planning Act restrict building height. In Kyoto City, the Building Standards Law in 1950 restricted building height in residential areas to 20 m and those in the other areas to 31 m. Based on the City Planning Act enforced in 1968, municipalities started imposing various restrictions. The City Planning Act designated use districts that restricted the purpose of land use and height control districts that restricted building height. A zoning system was also established for “areas and districts” to ensure reasonable land use by classifying land within city planning areas and imposing certain restrictions on buildings and structures. In Kyoto City, height control districts were designated in 1973 based on the City Planning Act. In 1996, the areas of aesthetic and scenic districts were expanded and the maximum building height in areas at the foot of a mountain and areas facing certain arterial roads was reduced from 20 m to 15 m.
In 2003, in the interest of tightening the height regulations of buildings in the above-mentioned CBD from the perspective of landscape improvement, areas which have 31 m regulation were divided between two types of regulations. The maximum height regulation of buildings remained 31 m after the revision in both areas, while the maximum heights of buildings along the boundary line with adjacent land lots and along front roads were reduced. Nevertheless, the revision of 2003 is thought to be a comparatively smaller change than the revision that took place in 2007.
Under these circumstances, restrictions on building height were revised in September 2007—the largest revision in recent years. This revision, a so-called “downzoning,” was carried out to reduce the maximum building height in almost all old city areas, more than 30% of residential areas at the foot of a mountain, areas facing certain arterial roads, areas in the western part of Kyoto City, and industrial areas in the southern part of Kyoto City. In particular, traditional urban houses called “Kyo-machiya” accumulated in a four-block area in the CBD. The Gion festival is held in this area, the history of which stretches over more than 1,000 years, and it was registered as a UNESCO Intangible Cultural Heritage practice in 2009. In the Gion festival, decorated floats called yamahoko (wooden landmarks) are displayed on roads in towns and are paraded one after another.
The buildings' maximum height was reduced from 31 m to 15 m in certain districts, including the area in and around which the yamahoko floats are displayed and paraded. In Shijo-dori and Oike-dori, which are north-end and central streets in the CBD, regulations on signboards were strengthened. Regulations on distant landscapes were added to restrictions on building height to protect mountain ranges that can be seen from river terraces, parks, and temple gardens. In particular, regulations on distant landscapes were applied to areas on the east side of the Kamo River in Kyoto City to prevent impeding the view of Nyoigatake Mountain because the Daimonji-yaki (Mountain Bonfire) has been performed there for years. These regulations on building heights are similar to the Fuseau Regulation in Paris, established in 1977.
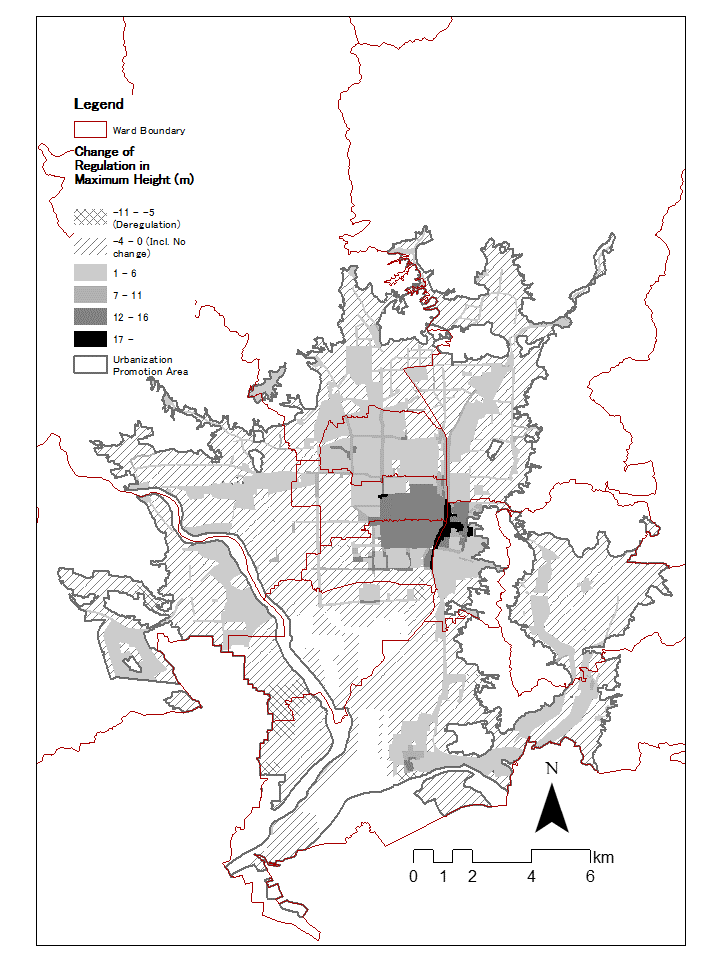
Fig. 8.3 shows the changes in the maximum building height in meters before and after Kyoto City’s enactment of the new Landscape Ordinance in 2007. The new Landscape Ordinance raised and reduced the maximum building height in different areas. The areas with diagonal lines and cross-hatched lines are designated as those with weaker regulation in height control. Buildings in these areas can be built with the same or higher height than before. Downzoning was carried out in areas shown in gray and black. In these areas, existing buildings that exceeded the maximum building height outlined in the new Landscape Ordinance were ranked as existing non-conformed buildings. In the future, new buildings in these areas must conform to the new Landscape Ordinance. Remarkable downzoning was observed in the CBD, the shape of which is close to a square. In this area, the new Landscape Ordinance reduced the maximum building height from 31 m to 15 m. In the black area at the east side of the CBD, which includes Yasaka Shrine (the location for the main ceremony of the Gion festival), the maximum building height was reduced from 31 m to 12 m. In the large gray areas that seem to surround the CBD, the maximum building height was generally reduced from 20 m to 15 m.
Downzoning could not be ignored as part of the gentrification process because the effect of downzoning on property prices was significant. In Fig. 8.1, areas with land prices that had markedly increased were exactly the same as those with severe downzoning. Because the supply of high-rise buildings was highly restricted, the supply-demand balance among high-rise buildings tightened, and consequently, land prices increased. The CBD at the eastern side of three wards in the downtown area became an exclusive residential district, promoting high-rise luxury condominium construction instead of the rebuilding of detached houses. In the CBD, people of productive ages became gentrifiers and drove an increase in the population. In other words, reinforcing regulations on height control districts in city planning brought “the first wave of gentrification” to Kyoto City: land prices in the CBD increased and people of productive ages (and their families) migrated into the CBD. It is important to describe “the first wave” because “the second wave” of gentrification subsequently occurred in Kyoto City. In the second wave of gentrification, the number of lodging houses increased. Therefore, the second wave of gentrification was considered to be driven by tourism.
Tourism and the Second Wave of Gentrification
The Regulatory Reform Implementation Plan, which was approved in a Cabinet meeting of the Third Abe Cabinet on June 30, 2015, states: “Regarding vacation rental services utilizing ordinary dwelling houses, summer houses, and so on, the lodgers of which are raised through the Internet, concerned government ministries shall examine the actual situation of the services from 2015, including competitive conditions with inns and hotels, from a very wide perspective, and shall obtain a conclusion in 2016.” In 2016, the Japan Tourism Agency (Commissioner Shigeto Kubo) and the Ministry of Health, Labor, and Welfare (Minister Yasuhisa Shiozaki) jointly examined these services, reviewing lodging house standards for structure, equipment, and furnishings. In April 2016, the Hotel Business Act was revised and the standards relaxed: before the revision, the gross floor area of guest rooms was to uniformly exceed 33 m2; after the revision, the gross floor area per person was changed to 3.3 m2 per lodger when the total number of guests is ten or smaller. Before the revision, the Hotel Business Act stated that each lodging house was obliged to install a reception desk. After the revision, the act stated that it is desirable for each lodging house to install a reception desk. Thus, the requirement to install a reception desk was relaxed.
Under the above-mentioned circumstances, Airbnb—a vacation rental site and available in Japan beginning in 2014—increased the number of registered facilities. In 2017, unauthorized vacation rental sites increased in many places in Japan. Vacation rental sites were criticized because some sites were inspected without warning by the Fair Trade Commission in November 2017. Around 10 vacation rental sites existed as of November 2017, and the competition among these sites to secure lodgers likely intensified in preparation for the 2020 Tokyo Olympics (2017, November 17) The Nikkei, Evening Edition, p.13. Subsequently, the Private Lodging Business Act (Home-Sharing Business Act) was enforced in the beginning of June 2018.
Kyoto City was significantly affected by the Cabinet’s decision. Fig. 8.4 shows the changes in the cumulative number of private lodging operators approved based on changes to the Hotel Business Act. The number of lodging houses has markedly increased since 2016 and reached its peak in 2019 before the COVID-19 pandemic. Indeed, the number of lodging houses in 2019 was approximately three times that of 2015.
In data on Kyoto, lodging houses are classified as accommodation facilities, as shown in Fig. 8.4. Kyoto City surveyed the number of inns to determine the number of unique accommodation structures called Kyo-machiya. According to Article 2, Paragraph 1 of the Ordinance on the Preservation and Utilization of Historical Buildings in Kyoto City, a Kyo-machiya is a traditional wooden townhouse that was already built when the Building Standards Law in 1950 was enacted. The Kyo-machiya has a traditional structure, morphology, and design generated in response to urban life. A typical Kyo-machiya has a tiled roof, the slope of which faces a road, and an entrance parallel to the ridge of the roof. It is a detached or terraced house with fewer than three stories, a beaten floor, and a street courtyard. Thus, several detailed features define these structures. In Fig. 8.4 these structures, referred to as “machiya” in the Hotel Business Act, are separated from other types of lodging houses, hotels consisting of medium- and high-rise buildings, and Japanese-style inns, all of which are combined.
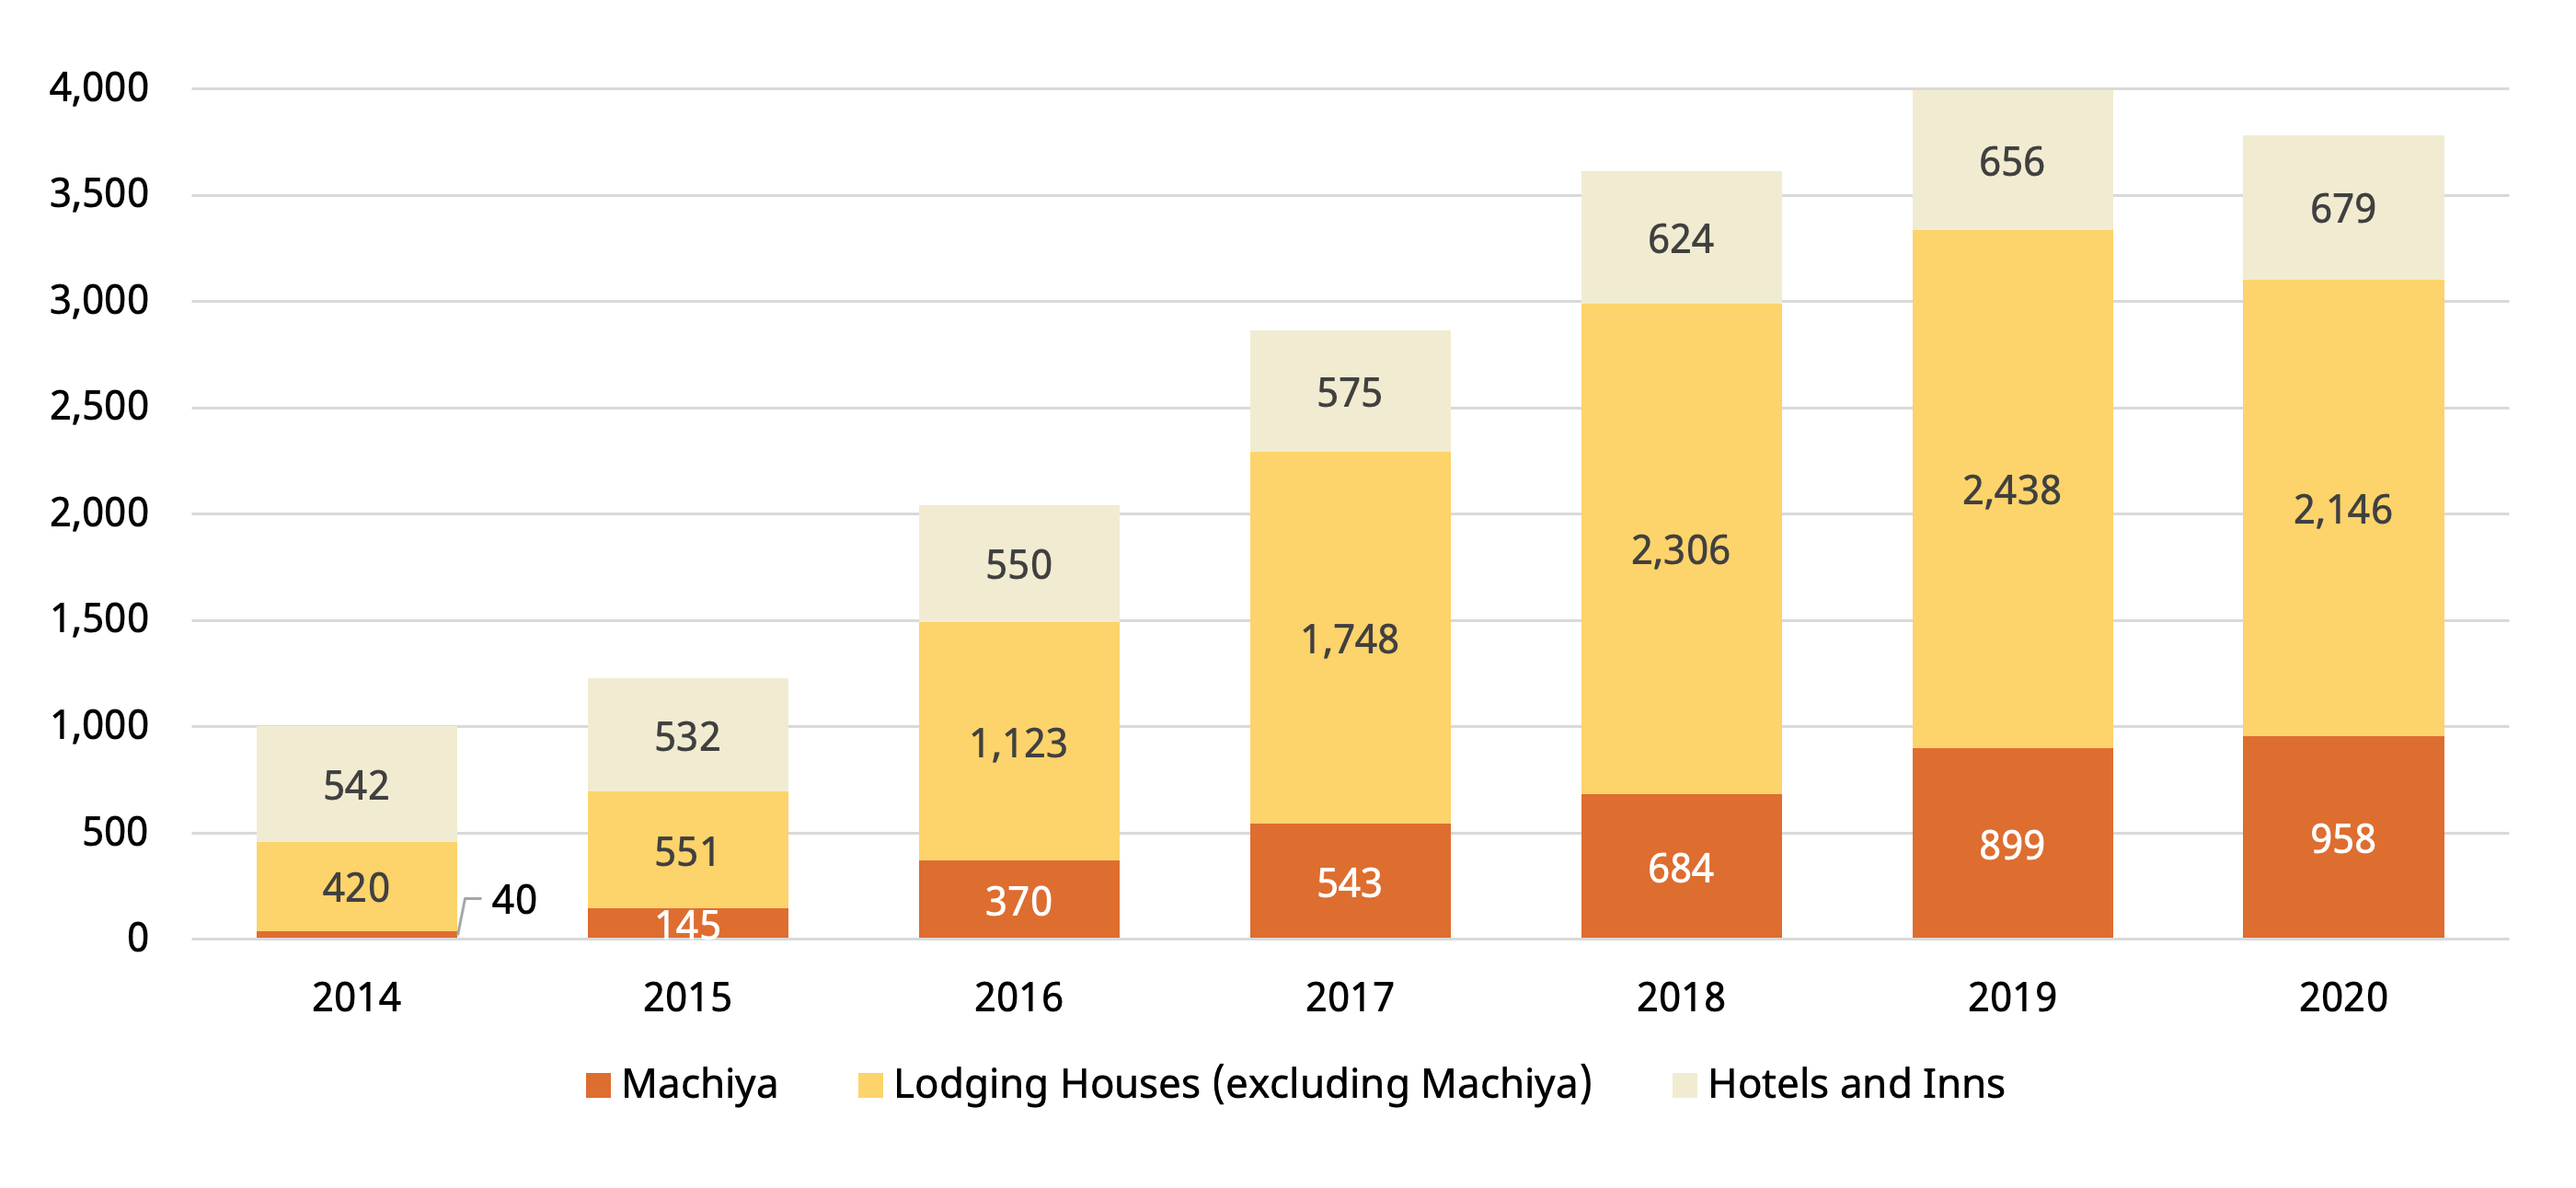
Fig. 8.5 shows the results of a questionnaire survey asking tourists visiting Kyoto City about their accommodation facilities in the form of a square graph. In this figure, the vertical axis represents the ratios of accommodation facilities and the horizontal axis represents tourists' home countries and regions. On the horizontal axis, the width of each country or region corresponds to the percentage of the total number of tourists that visit from the particular country or region. The survey was conducted at the same time on the same day of the week in each of February, May, August, and November in 2019. In the survey, 1732 foreign tourists were randomly selected and then interviewed. The number of tourists from the countries and regions described in the graph accounted for 92.7% of the total number of tourists. Tourists from other countries and regions, making up 7.3% of the total number of tourists, are omitted from this graph.
As shown in Fig. 8.5, the numbers of tourists staying in hotels, inns, and lodging houses were totaled according to their accommodation facilities. The number of tourists staying at friends and relatives' houses, machiya, guest houses, and pilgrims' lodgings were also totaled. Many lodging houses might be apartments and condominiums, and many friends and relatives' houses might be private houses. Because inns, machiya, guest houses, and pilgrims' lodgings are Japanese-style accommodation facilities, the countries and regions with higher percentages of the numbers of tourists staying at these facilities are arranged from the left to the right in this figure. However, since some tourists might have confused inns with machiya, it may be necessary to combine these two types of facilities. The highest percentage of foreign tourists intending to stay in Japanese-style facilities came from Taiwan, followed by South Korea, North America, Hong Kong, Europe, Oceania, China, and Southeast Asia, in that order. Many tourists from Europe intended to stay in hotels, yet the largest number of tourists staying at machiya, guest houses, and pilgrims' lodgings came from Europe. Many Chinese tourists stayed at lodging houses as guests and they can be regarded as the major users in terms of the total number. Tourists with small budgets might intend to stay at lodging houses and tourists with large budgets might intend to stay at hotels, even if their individual lifestyles differ. Thus, economic background might help to determine tourists' intentions.
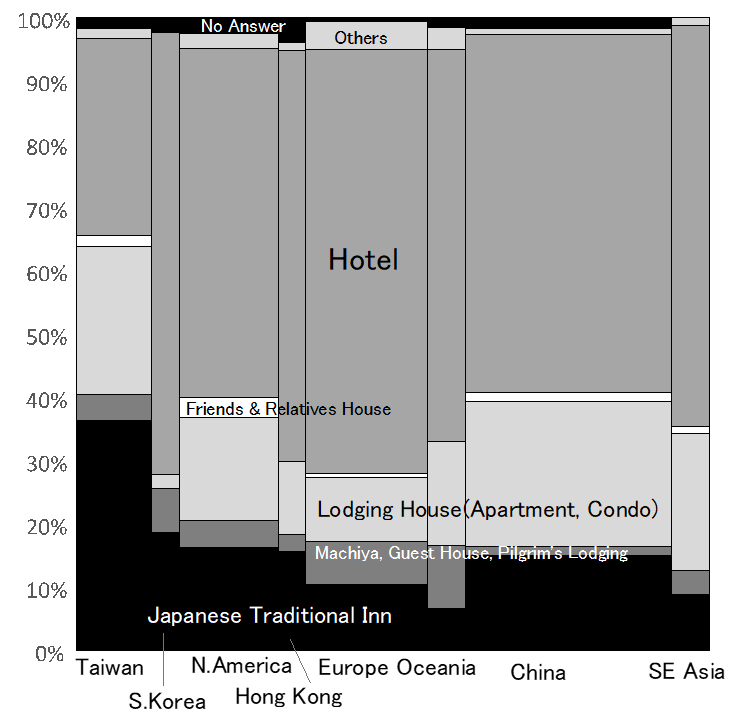
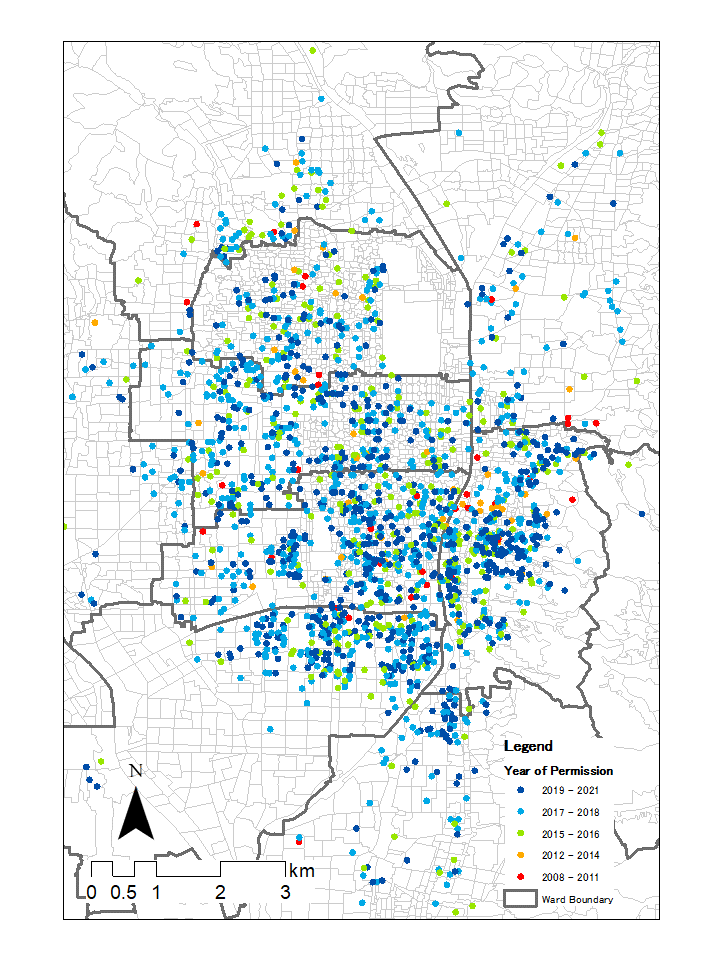
Fig. 8.6 shows a distribution chart of lodging houses registered after 2008, as permitted by the Hotel Business Act, obtained from the list of facilities as of January 2021. Kyoto City has occasionally published this list. In this figure, three wards in the downtown area and Higashiyama Ward are magnified. Fig. 8.6 excludes hotels and inns but includes 2,998 lodging houses registered and on the list. Since addresses in Kyoto City are expressed in a complicated manner (for example, north or south is attached to the name of a street), block names and house numbers, excluding the complicated expressions, were converted into latitudes and longitudes using the CSV Address Matching Service provided by the University of Tokyo. Subsequently, lodging houses were plotted using ArcGIS’s function for adding XY data. When address matching was performed, some towns with detailed house numbers could not be searched. Therefore, some errors occurred. In the other towns, house numbers could be searched. When several addresses were registered for one lodging house, the first address was used for the search. As a whole, house numbers could be searched for 2,660 lodging houses, block names could be searched for 255 lodging houses, and house numbers or block names of remaining lodging houses were unknown. The locations of the unknown lodging houses were amended by visual inspection. When the confidence level of the uniqueness of data matching was confirmed, 2,942 lodging houses could be correctly searched. However, 56 lodging houses had multiple block names and their locations were also amended by visual inspection.
In Fig. 8.6, lodging houses that have been newly permitted since 2017 are shown in blue, those permitted before 2011 are shown in red, and those permitted between 2012 and 2014 are shown in orange. As this figure highlights, the number of lodging houses permitted in recent years increased in areas just outside the CBD where downzoning had been carried out. These areas were located on the CBD’s eastern and southern sides and the southern side of Kyoto Station. In other words, the increase in the number of lodging houses indicates that many areas used for private housing located outside the CBD were converted to areas used for lodging facilities. Importantly, the reason for this conversion is the decrease in the number of elderly people, as shown in the right graph in Fig. 8.2. While the operators of hotel businesses are carefully avoiding increases in land prices due to downzoning—which occurred in areas at the eastern side of Nakagyo Ward and the northern side of Shimogyo Ward—elderly peoples' homes have been targeted, and residential areas have been changed into “lodging house towns.”
Under the Hotel Business Act, one operator registers one facility. Therefore, the effect of building a large-scale hotel with a large number of guest rooms differs greatly from the effect of building a lodging house with a small number of guest rooms. Based on Kyoto City Tourism Association’s () estimation, as of January 2021, the number of lodging houses in Kyoto City slightly increased from the list’s number. Currently, the number of lodging houses in Kyoto City is 3,337 and the number of guest rooms is 17,228. Therefore, the average number of guest rooms per lodging house is 5.2. Currently, the number of hotels and inns in Kyoto City is 656, and the number of guest rooms in these is 36,243. Therefore, the average number of guest rooms per hotel or inn is 55.2. Although the number of hotels and inns is only one-fifth that of lodging houses, the number of guest rooms per hotel or inn is approximately 10 times that of guest rooms per lodging house.
Because the number of lodging houses is approximately five times that of hotels and inns, the effect of lodging houses on the architectural landscape is markedly larger than that of hotels and inns because lodging houses are widely distributed geographically. The psychological effect of lodging houses on people moving on roads near these facilities is also markedly larger than that of hotels and inns because these people more often encounter lodging houses.
Conclusion
From the beginning of the 2000s to 2021, Kyoto City experienced two waves of gentrification as a tourist center and historical city. Despite the 2008 global economic downturn, the first wave of gentrification led to increases in land prices in the CBD. The structural change in the relative population balance due to increases in the numbers of people at productive ages and their children also occurred in the CBD and its surrounding districts. The CBD, in which land prices had increased, was almost the same as a zone in which the maximum height of buildings was severely restricted by Kyoto City’s city planning authority in September 2007 to solve the long-term landscape conservation problem. Downzoning through reducing the maximum height of buildings triggered increases in land prices and generated a wave of gentrification. Furthermore, the CBD in Kyoto City not only had a business function but also a cultural function because of the Gion festival. Since additional values produced by the traditional event combined with downzoning to tighten the supply-demand balance in the real estate market, property values in the downtown area rapidly increased. As a result, richer young families and their children slowly and steadily migrated to the downtown area, partly because the high density condominiums were comparatively affordable.
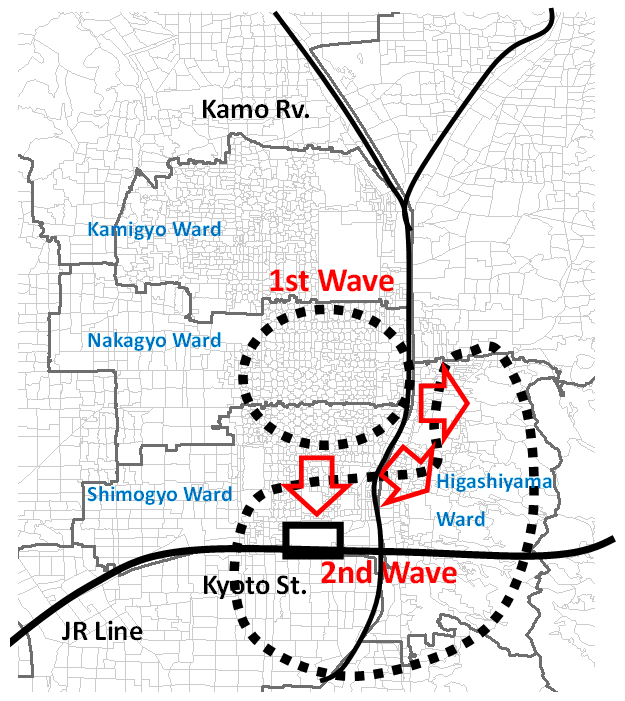
The second wave of gentrification was prompted by the rapid increase in the number of lodging houses after the revision of the Hotel Business Act in April 2016. The Japanese government foresaw the expansion of online reservation sites such as Airbnb, which advocate a sharing economy, and actually abolished the standards for the structure, equipment, or furnishings in lodging houses, removing the requirements for those houses with less than ten lodgers to possess a minimum gross floor area of 33 m2 for guest rooms and install a reception desk. This change meant that many small-scale detached houses and condominiums were converted into lodging houses called vacation rentals. At that time, municipalities—which urgently needed to take measures to utilize vacant houses because the ratio of the number of vacant houses to the total number of houses was as high as 14%—had to yield to the strong pressure to develop lodging houses. As a result, these municipalities have continuously permitted an unprecedented number of lodging houses. The convenience of intercity travel and the excellent accessibility of its famous tourist spots led to a remarkable increase in the number of lodging houses in areas on the CBD’s eastern and southern sides (the inner areas). In these areas, which had an aging population and conspicuous vacant houses, private houses that elderly people had lived in became vacation rentals with a Japanese-style façade and stylish curtains, and foreign tourists walked on nearby streets while noisily pulling suitcases. Such scenery has penetrated the daily lives of people living in nearby areas. It can be said that Airbnb kicked the elderly out of the inner areas of Kyoto. The area that saw the largest increase in lodging houses is the same area where the number of people aged above 65 years has decreased the most. Fig. 8.7 shows the above-mentioned structural changes in Kyoto City.
Since 2017, vacationers illegally dumping garbage and the generation of unfamiliar noises have become serious problems, leading to an inquiry that resulted in most vacation rentals remaining permitted while various measures were enacted to regulate them. The newly enforced in 2018 Private Lodging Business Act (Home-Sharing Business Act) tightened the requirements for installing a reception desk. An office near the rental meant to manage vacation rental users' manners and conduct became a condition for permission. In particular, because the number of potential vacant houses was large in Higashiyama Ward and Shimogyo Ward, which had an increasingly aging population, regulations on vacation rentals have been tightened. In the second wave of gentrification, approximately 3,000 dwelling houses were converted into lodging houses. If two people were assumed to originally live in one dwelling house, the dwelling houses where 6,000 people had lived were converted into lodging houses. Moreover, the number of lodging houses registered after 2008 was 445 in Shimogyo Ward and was 199 in Higashiyama Ward. The number of people aged above 65 years decreased after 2005 by 1,566 in Shimogyo Ward and 745 in Higashiyama Ward. Overall, the number of lodging houses increased in these two wards by 644 and the number of people aged above 65 years decreased in these two wards by 2,311. Therefore, one out of two dwelling houses vacated by people above 65 years of age was converted into a lodging house.
An increase in the number of accommodation facilities does not directly result in an increase in the residential population. However, if vacant houses are used as lodging houses, the conversion of dwelling houses into lodging houses cannot be negatively evaluated in general. One interpretation of the situation is that when the number of lodging houses increases, a new flow of people is generated, and consequently the area is better utilized. From this perspective, the conversion of dwelling houses into lodging houses cannot be said to be typical gentrification.
Due to landscape policies adopted by municipalities and the government’s relaxation of regulations, the direction of contemporary capitalism changes a city’s structure. In Kyoto City, the gentrification caused by the immigration of young families into the CBD and the outflow of elderly people from the inner area has become a kind of displacement. We agree that the preservation of landscapes and the revitalization of regional economy could be understood as public values. We ask, however: did the government deeply consider the rapid change in urban structure caused by the immigration of young families and the emigration of elderly people? The authorities cannot ignore the provision of sufficient welfare facilities because this can also be considered as a public value.
Since April 2020, five waves of the novel coronavirus in Japan have impacted the society and economy, and the effects of these five waves on the urban structure is still unknown. However, we must also firmly grasp the meaning of the two waves of gentrification. Based on this understanding, we can then carefully observe the effect of the COVID-19 calamity on gentrification in the future.
Bibliography
- Dinga et al. 2016
- Dinga, L., Hwang, J., & Divringi, E. (2016). Gentrification and residential mobility in Philadelphia. Regional Science and Urban Economics. 38-51. http://doi.org/10.1016/j.regsciurbeco.2016.09.004
- Fujitsuka, 2017
- Fujitsuka, Y. (2017). Gentrification. Tokyo: Kokon Shoin. (In Japanese).
- Kyoto City Tourism Association (DMO KYOTO) and Kyoto Convention Bureau (August 31, 2020)
- Kyoto City Tourism Association (DMO KYOTO) and Kyoto Convention Bureau (August 31, 2020). Monthly Data Report of the Kyoto City Tourism Association (July 2020). (In Japanese).
- Liu et al. 2019
- Liu, C., Deng, Y., Song, W., Wu, Q., and Gong, J. (2019). A comparison of the approaches for gentrification identification. Cities, 95, 1-14. http://doi.org/10.1016/j.cities.2019.102482
- McKinnish et al. 2010
- McKinnish, T., Walsh, W., & White, K. (2010). Who gentrifies low-income neighborhoods? Journal of Urban Economics, 67(2), 180-193. https://doi.org/10.1016/j.jue.2009.08.003
- Meltzer and Ghorbani, 2017
- Meltzer, R. & Ghorbani, P. (2017). Does gentrification increase employment opportunities in low-income neighborhoods? Regional Science and Urban Economics, 66, 52-73. http://dx.doi.org/10.1016/j.regsciurbeco.2017.06.002
- Nakamura & Taji, 2020
- Nakamura, K. & Taji, T. (2020). Urban formation in Higashikujo Area, Kyoto in the early modern age. Analysis of the relationship between landowners' land management and urbanization process. Journal of Architecture and Planning, 85(777), 2455-2465. https://doi.org/10.3130/aija.85.2455
- Smith & Williams, 1986
- Smith, N. & Williams, P. (1986). Gentrification of the City. Allen & Unwin.